Recently when I deploying one of my Next.js applications to production, after running the command yarn build, it stucks on Creating an optimized production build ... forever:
This is kind of weird as it works well on my local machine but hangs here almost everytime I run it on production.
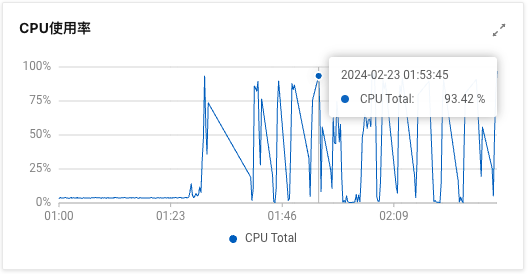
Checked online monitor and I noticed the high CPU and memory usage:

I've tried many ways to solve this problem:
yarn build againyarn install againNone of them worked, it just stuck on Creating an optimized production build ... forever, this issue drives me crazy!
To further diagnose the problem, I decided to deploy my application to another server on DigitalOcean to see if the issue was specific to the Aliyun ECS machine.
Unfortunately I got the same result. But additionally I got an error shows on the screen:
FATAL ERROR: Reached heap limit Allocation failed - JavaScript heap out of memory
<--- Last few GCs --->

[1120666:0x6ef96b0]    87503 ms: Mark-Compact (reduce) 462.5 (486.3) -> 461.9 (485.8) MB, 690.73 / 0.00 ms  (average mu = 0.260, current mu = 0.170) allocation failure; GC in old space requested
[1120666:0x6ef96b0]    88403 ms: Mark-Compact (reduce) 462.3 (486.3) -> 462.0 (486.5) MB, 762.13 / 0.00 ms  (average mu = 0.207, current mu = 0.153) allocation failure; GC in old space requested


<--- JS stacktrace --->

FATAL ERROR: Reached heap limit Allocation failed - JavaScript heap out of memory
----- Native stack trace -----

 1: 0xcc0a72 node::OOMErrorHandler(char const*, v8::OOMDetails const&) [/usr/bin/node]
 2: 0x1054530 v8::Utils::ReportOOMFailure(v8::internal::Isolate*, char const*, v8::OOMDetails const&) [/usr/bin/node]
 3: 0x1054817 v8::internal::V8::FatalProcessOutOfMemory(v8::internal::Isolate*, char const*, v8::OOMDetails const&) [/usr/bin/node]
 4: 0x1273a55  [/usr/bin/node]
 5: 0x128a578  [/usr/bin/node]
 6: 0x1261a7e v8::internal::HeapAllocator::AllocateRawWithLightRetrySlowPath(int, v8::internal::AllocationType, v8::internal::AllocationOrigin, v8::internal::AllocationAlignment) [/usr/bin/node]
 7: 0x1262d64 v8::internal::HeapAllocator::AllocateRawWithRetryOrFailSlowPath(int, v8::internal::AllocationType, v8::internal::AllocationOrigin, v8::internal::AllocationAlignment) [/usr/bin/node]
 8: 0x123f986 v8::internal::Factory::AllocateRaw(int, v8::internal::AllocationType, v8::internal::AllocationAlignment) [/usr/bin/node]
 9: 0x12314e4 v8::internal::FactoryBase<v8::internal::Factory>::AllocateRawWithImmortalMap(int, v8::internal::AllocationType, v8::internal::Tagged<v8::internal::Map>, v8::internal::AllocationAlignment) [/usr/bin/node]
10: 0x123380f v8::internal::FactoryBase<v8::internal::Factory>::NewRawTwoByteString(int, v8::internal::AllocationType) [/usr/bin/node]
11: 0x155dd05 v8::internal::String::SlowFlatten(v8::internal::Isolate*, v8::internal::Handle<v8::internal::ConsString>, v8::internal::AllocationType) [/usr/bin/node]
12: 0x10623fd v8::String::Utf8Length(v8::Isolate*) const [/usr/bin/node]
13: 0xdc1baf  [/usr/bin/node]
14: 0x1a6aadd  [/usr/bin/node]
Compiler server unexpectedly exited with code: null and signal: SIGABRT
OK. Perhaps there is something to do with memory leak?
I searched online, maybe the memory allocated to Node.js is insufficient.
I then use this command to see the current value of max-old-space-size:
node -e ‘console.log(v8.getHeapStatistics().heap_size_limit/(1024*1024))’
the result is only 512MB.
OK, I increased the memory to 2GB:
export NODE_OPTIONS="--max-old-space-size=2048"
then run yarn build again to see if it works now.
After waiting for about 1min, the build process exited with the following error:
Compiler server unexpectedly exited with code: null and signal: SIGKILL
S**t! Why is this happening? I have no idea cause there is no more other logs to check.
Eventually, I had to take the build process on my local machine.
I use Docker to build on my local and push to production to deploy the application. Unfortunately this is the only workaround I've found for now.
Many Next.js users faced the problem:
https://github.com/vercel/next.js/discussions/60147
https://github.com/vercel/next.js/issues/32314
https://github.com/vercel/next.js/issues/54708
Some of them were able to solve it by the approaches I mentioned above, but none of those worked for me.
https://www.toptal.com/nodejs/debugging-memory-leaks-node-js-applications
扫描二维码添加微信